
- The commercial offices segment dominated PE transactions in FY24 with a 57% value share
- The share of the top 10 deals has increased primarily due to the USD 1.4 Bn GIC-Brookfield deal
- Aggregate deal value lower due to 30% reduced avg. deal size – to USD 75 Mn in FY24 from USD 107 Mn in FY20
- In residential RE, aggregate investment lower than in FY23
- Share of foreign capital in total investments down to 65% in FY24 from 78% in FY20; investments by domestic investors increased to 29%
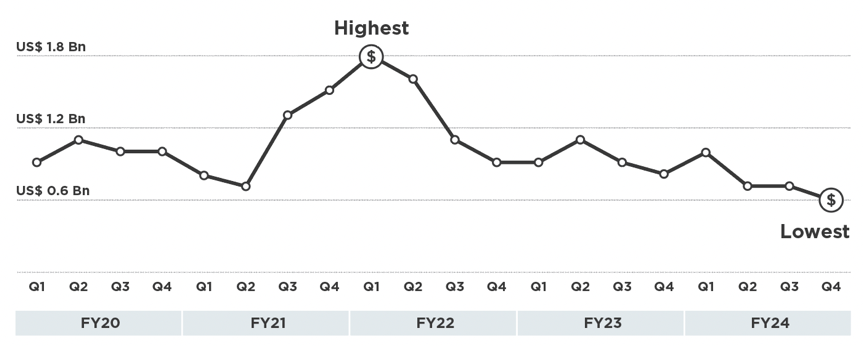
The ANAROCK Capital FLUX report for FY2024 finds that the aggregate value of private equity deals in Indian real estate has declined steadily over the past 5 years – from USD 5.1 Bn in FY20 to USD 3.7 Bn in FY24.
|
Amount (USD Mn) |
|
|
FY20 |
5,138 |
|
FY21 |
6,377 |
|
FY22 |
4,236 |
|
FY23 |
4,358 |
|
FY24 |
3,674 |
“The decline in PE investments in Indian real estate has been due to lower activity by foreign investors, due to global macro-economic factors and geopolitical instability,” says Shobhit Agarwal, MD & CEO – ANAROCK Capital. ”The share of foreign capital in total investments declined to 65% in FY24, against 78% in FY20. Correspondingly, investments by domestic investors have increased to 29% of the total capital inflows into Indian real estate in FY24, as compared to merely 8% in FY20.”
Top 10 PE Deals in FY24
Top 5 Equity Deals
|
Investors |
Investee Company |
Amount (INR Cr) |
Amount (USD Mn) |
|
GIC + Brookfield REIT |
Brookfield |
11,596 |
1,400 |
|
CPPIB |
RMZ |
2,650 |
325 |
|
Kotak – ADIA |
Prestige Estates |
2,001 |
240 |
|
Edelweiss Alternative Funds |
MFAR |
1,475 |
178 |
|
Morgan Stanley |
Prakhhyat Group |
700 |
85 |
Top 5 Debt Deals
|
Investors |
Company |
Amount (INR Cr) |
Amount (USD Mn) |
|
Varde |
Phoenix Group |
750 |
91 |
|
HDFC Capital |
CCI Projects |
560 |
68 |
|
PAG |
Kalpataru |
525 |
63 |
|
PAG |
M3M India |
400 |
48 |
|
Edelweiss Special Opportunity Fund |
Adarsh Developers |
350 |
42 |
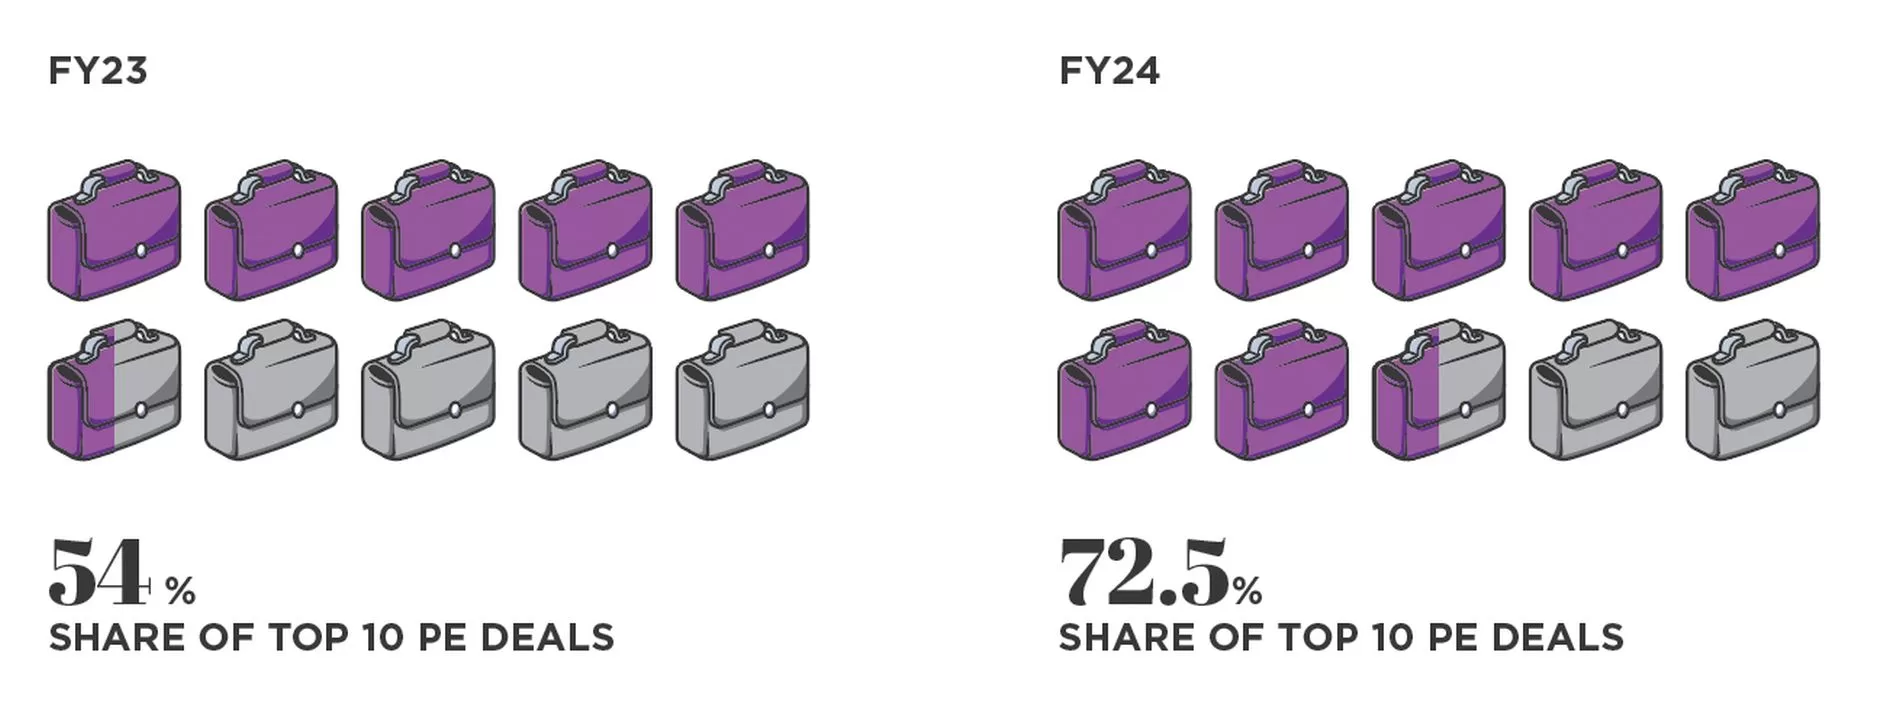
The share of the top 10 deals has increased primarily due to the USD 1.4 Bn GIC-Brookfield deal (approx..40% of the overall deal value for FY24), reported at the beginning of FY24.
Share of top 10 deals – FY23: 54%, FY24: 72.5%
No. of Deals & Average Ticket Size
While the number of deals in FY24 is largely constant, the aggregate deal value has reduced due to a sharply lower average deal size. The average ticket sizes have reduced by 30% – to USD 75 Mn in FY24 from USD 107 Mn in FY20.
|
No. of deals |
Average Deal Size (USD Mn) |
|
|
FY20 |
48 |
107.0 |
|
FY21 |
43 |
148.3 |
|
FY22 |
54 |
78.4 |
|
FY23 |
55 |
79.2 |
|
FY24 |
49 |
75.0 |
Movement of Capital Inflow
Multi-city transactions clearly stole the limelight during FY24, with the GIC-Brookfield transaction and the fund raise by Prestige Estates. NCR witnessed a relatively muted year, while MMR continued to dominate city-specific deal tables.
|
|
FY23 |
FY24 |
|
NCR |
30% |
9% |
|
MMR |
13% |
25% |
|
Bengaluru |
16% |
8% |
|
Chennai |
7% |
1% |
|
Hyderabad |
4% |
7% |
|
Pune |
2% |
1% |
|
Multiple |
16% |
49% |
|
Others |
11% |
0% |
Equity vs Debt Funding
PE investors prefer equity investments, as evidenced by the fact that the share of equity deals remains healthy and at par with the average of ~75% in the past 5 years.
|
Debt |
Equity |
|
|
FY20 |
26% |
74% |
|
FY21 |
11% |
88% |
|
FY22 |
20% |
78% |
|
FY23 |
32% |
66% |
|
FY24 |
24% |
73% |
Asset Class-wise Funding
The commercial offices segment dominated PE transactions in FY24 with a 57% value share. This was largely due to the GIC-Brookfield deal, which accounted for approx.40% of total transaction value in FY24.
|
FY23 |
FY24 |
|
|
Offices |
38% |
57% |
|
Residential |
28% |
28% |
|
Industrial & Logistics |
6% |
10% |
|
Data Centre |
3% |
2% |
|
Land |
4% |
2% |
|
Portfolio / Mixed use / Entity |
10% |
2% |
|
Others |
11% |
0% |
“While there has been a consistent share of PE investments in residential real estate at 28% YoY, there is a yearly decline of 17% in the same by value,” says Shobhit Agarwal. “This is due to a very high base in FY23, when investments had doubled over the previous years.”
(in USD Bn)
|
FY20 |
FY21 |
FY22 |
FY23 |
FY24 |
|
|
Residential |
0.6 |
0.7 |
0.6 |
1.2 |
1.0 |
Domestic vs Foreign Funding
In the overall investments during FY24, foreign capital saw its share drop to 65% in FY24 while the share of domestic investor rose to 29% (against 8% in FY20).
|
Foreign |
Domestic |
|
|
FY20 |
78% |
8% |
|
FY21 |
95% |
5% |
|
FY22 |
83% |
14% |
|
FY23 |
76% |
24% |
|
FY24 |
65% |
29% |
For all charts:
Numbers rounded off to the nearest decimal; All transactions in USD ($) unless otherwise stated
FY = Financial Year (1st April – 31st March)
Source: ANAROCK Capital Market Research
FY24: Key Highlights & Events
- Residential
“Residential real estate witnessed another year of a strong upcycle due to increased project launches, sales volumes, and price appreciation. Demand for affordable housing reduced, and that for larger homes increased,” says Aashiesh Agarwaal, SVP – Research & Investment Advisory, ANAROCK Capital. “The luxury homes market continues to post a robust performance. Interestingly, demand for under construction properties rose sharply during the year. The improved sentiment has also encouraged large investor to increase their participation in the market. However, the aggregate investment in the sector is lower than in FY23, due to some larger-than-average transactions during the last year.”
- Commercial Office
Commercial real estate deals remained very thin on the ground, due to multiple factors such as the delayed notification of SEZ amendments, elevated interest rates, and global uncertainties. However, given strong demand fundamentals of commercial real estate, driven by leading IT companies’ determined push to return to office, increased traction of co-working spaces, a favorable capex cycle, the amendment of SEZ laws, and expectations of lower interests, commercial office real estate activity should strengthen over the coming quarters.
- Retail
The retail segment of Indian real estate is thriving due to economic growth. Key names in the nation’s mall development arena, including DLF, Lakeshore, Inorbit, Nexus and Phoenix, are aggressively pursuing expansion. This surge in capital allocations aligns with the expansion strategies of leading retailers, resulting in a substantial uptick in store numbers. Rentals are expected to firm up, since economic buoyancy and robust consumer sentiment has led to healthy demand and trading densities for retail assets.
- Industrial & Logistics
The industrial & logistics segment continues to hold promise for investors, with strong growth prospects on the back of robust consumption and expectations of manufacturing-led growth. While transactions in this segment were thin in FY24, they are expected to revive in FY25.
- SM REITs
Towards the end of FY24, SEBI notified amendments to REIT regulations, paving the way for Small and Medium Real Estate Investment Trusts (SM REITs). This move aims to regulate fractional ownership of properties. Under these regulations, the minimum subscription size is INR 10 lakhs, the minimum number of investors is 200, and asset size can range between INR 50 Cr to INR 500 Cr.
- Stressed Assets
While this segment has seen the emergence of a class of investors specializing in stressed asset resolutions, lenders are increasingly likely to settle with the promoters to avoid litigations.
- AIFs
In December 2023, RBI issued a circular barring lenders from investing in AIFs where the AIFs had lent downstream to companies wherein the lender had exposures. For existing investments, lenders were required to liquidate within 30 days, or to set aside higher provisioning (100%) for their investments in such AIFs.
However, the end of March 2024 brought a breather – lenders were allowed to invest AIFs which has invested in a debtor company of the former. The RBI also gave relief on provisioning norms – provisioning would be required only to the extent of the lender’s investment in the AIF scheme, which is further invested by the fund in the debtor company.
Download ANAROCK Capitals FLUX FY24 annual edition: https://bit.ly/IBFLUXFY24